


A nutrition label answers four questions if you read it in the right order: how much is a serving, how many servings are in the pack, how much of the things you are limiting does a serving carry, and how much of the things you want. Most people read it in the wrong order, starting with the calorie number and never reaching the serving size that makes the calorie number meaningful. This guide explains the US label and the Indian label, the percent daily value shortcut, the added-sugar line, the legal tolerance that lets a label under-state calories by up to 20%, and the three quick calculations that turn a label into a decision.
Start With the Serving Size
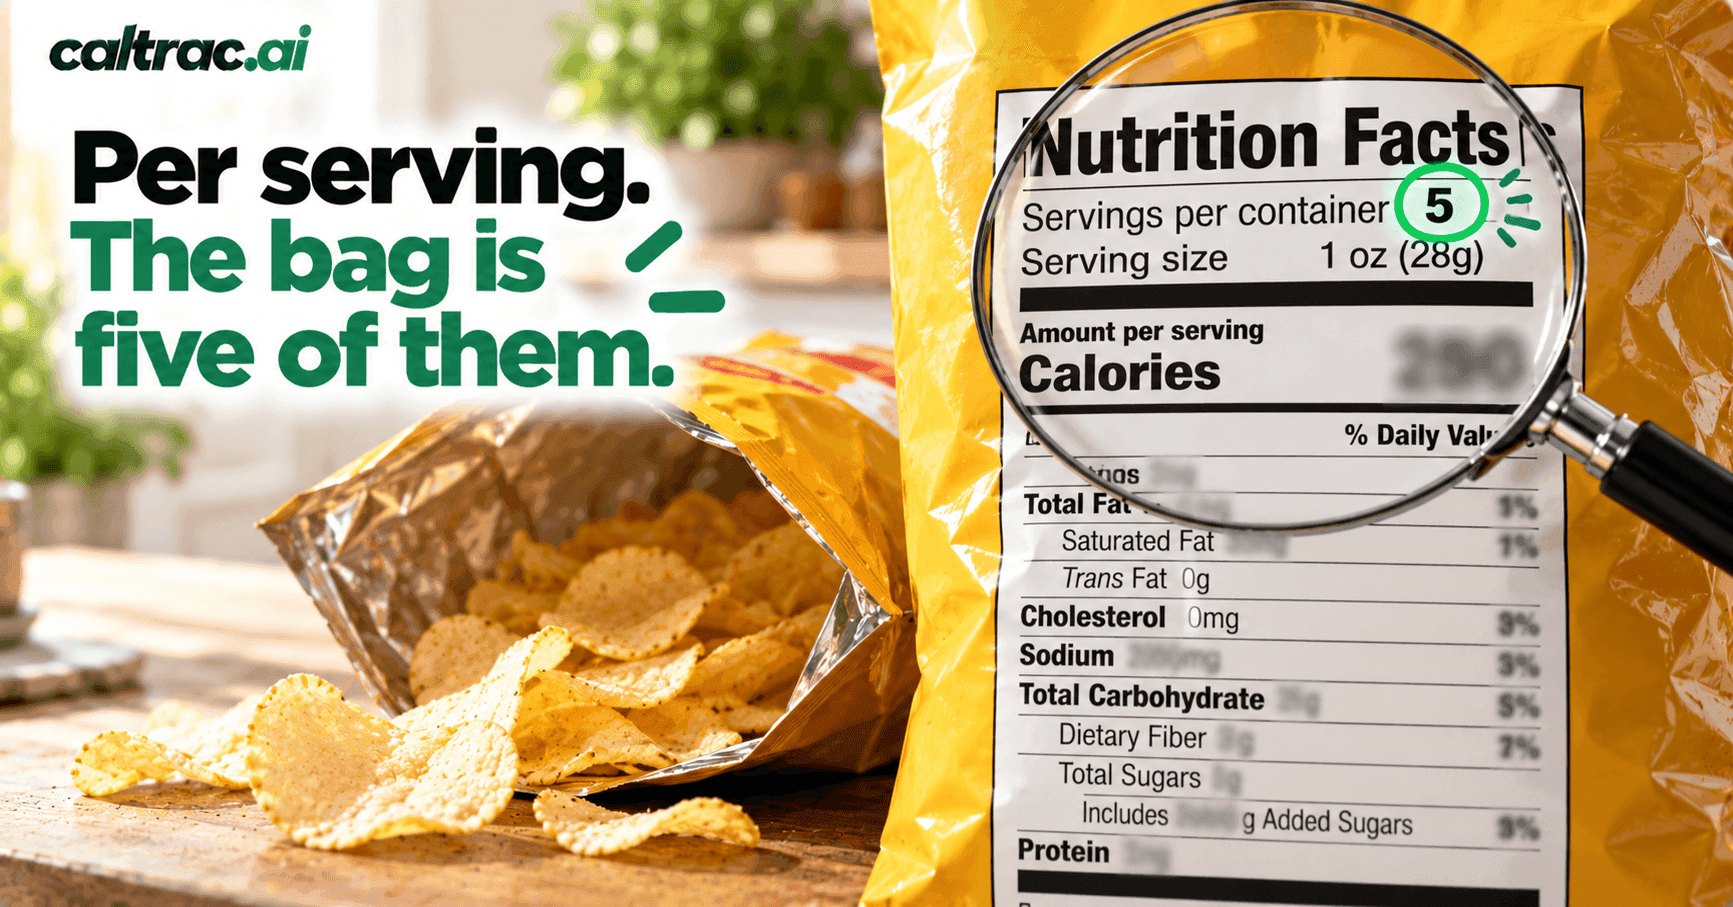
The serving size is the first line for a reason: everything else on the label is per serving, and the serving is set by the manufacturer within rules that reflect what people typically eat, not what they should eat. The FDA's own guidance makes the point directly: "pay attention to the serving size, especially how many servings there are in the food package," and the serving size "is not a recommendation of how much you should eat" [1].
The arithmetic error this produces is the most common one in tracking. A 150 g bag of chips labelled "28 g serving, 150 kcal" is five and a third servings and 800 kcal [2]. A 500 ml bottle of cola labelled per 250 ml is two servings. A jar of peanut butter lists two tablespoons, 32 g, at about 190 kcal [3]; a heaped spoon is often 25 g on its own.
Indian labels, under the Food Safety and Standards Authority of India's 2020 labelling regulations, must give nutrition information per 100 g or 100 ml or per single-consumption pack, together with the per-serve percentage contribution to the recommended daily allowance, and must state the serving weight in grams or millilitres and the number of servings in the pack [4]. The per-100 g column is the useful one for comparing products; the per-serve column is the useful one for logging, as long as you check the serving against what you actually ate.
The Percent Daily Value Shortcut
The %DV column tells you how much of a day's worth of each nutrient one serving provides, based on a 2,000 calorie reference diet [1]. The FDA's rule of thumb is that 5% DV or less of a nutrient per serving is low and 20% DV or more is high [1]. That works in both directions: you want saturated fat, sodium and added sugars low, and fibre, calcium, iron and potassium high.
The reference values behind the percentages, for adults and children over four, are:
| Nutrient | Daily Value | Aim |
|---|---|---|
| Added sugars | 50 g | Less |
| Saturated fat | 20 g | Less |
| Sodium | 2,300 mg | Less |
| Total fat | 78 g | Context |
| Total carbohydrate | 275 g | Context |
| Dietary fibre | 28 g | More |
| Protein | 50 g | More for most people |
| Calcium | 1,300 mg | More |
| Iron | 18 mg | More |
| Potassium | 4,700 mg | More |
Source: FDA Daily Value reference [5]. India's regulations use a similar basis: 2,000 kcal, 67 g total fat, 22 g saturated fat, 2 g trans fat, 50 g added sugar and 2,000 mg sodium [4].
Two caveats. The 2,000 calorie reference is higher than the maintenance of most women and lower than that of most active men, so a 20% DV of sodium is more than 20% of a smaller person's budget. And the protein DV of 50 g is a floor; research puts the useful range for weight loss and appetite control at 1.2 to 1.6 g per kilogram, 85 to 110 g for a 70 kg adult [6].
The Added Sugars Line
The modern US label separates total sugars from added sugars, which is the line that matters. Total sugars include the lactose in milk and the fructose in fruit, which come with protein, fibre and nutrients; added sugars are the ones put in during processing, and the Dietary Guidelines set a ceiling of less than 10% of calories from them, about 50 g on 2,000 kcal [7], matching the WHO's 10% recommendation with further benefit below 5% [8]. Indian labels must now declare added sugars separately too [4].
A plain Greek yogurt shows about 4 g of total sugars per 100 g and zero added, because the sugar is lactose [9]. A granola can show 20 g of sugar per 100 g with much of it added [10]. A can of cola is 10 g of sugar per 100 ml, all added, 33 g per 330 ml can [11]. The added-sugar line is how you tell the three apart without reading the ingredients.
What the Label Is Allowed to Get Wrong
Labels are not measurements; they are declarations within a tolerance. Under US regulation, a food is misbranded only if its actual calories, sugars, fat, saturated fat, trans fat, cholesterol or sodium exceed the declared value by more than 20%; for naturally occurring protein, fibre, vitamins and minerals, the actual content must be at least 80% of the declaration [12]. In other words, a product labelled 200 kcal can legally contain 240. Indian regulations allow a tolerance of minus 10% on declared nutrient quantities through the product's shelf life [4].
How far off are labels in practice? When 24 common snack foods were measured by bomb calorimetry, calories were on average 4.3% higher than the label, about 7 kcal a serving, and serving weights 1.2% heavier, all within the legal limits [13]. Restaurant food is worse: 29 chain-restaurant items averaged 18% more energy than stated, and 10 supermarket frozen meals 8% more, with some items at double their stated value [14]. Diners at fast-food chains, which must post calories if they have 20 or more locations [15], underestimated their meals by about 175 kcal against a true average of 836 [16].
The practical conclusion is that packaged-food labels are good enough for tracking, with a systematic lean of a few percent in the manufacturer's favour, and restaurant figures should be treated as a floor rather than a fact.
Three Calculations That Turn a Label Into a Decision
Protein per 100 kcal. Divide the protein grams by the calories and multiply by 100. Anything over 10 g per 100 kcal is a protein food; under 5 g is not, however the front of the pack reads. Greek yogurt at 9.5 g per 54 kcal is 17.6 g per 100 kcal [9]; a granola at 13.7 g per 489 kcal is 2.8 [10].
Fibre per 100 kcal. Same arithmetic. Over 3 g per 100 kcal is high-fibre; under 1 g is refined. Fibre predicted weight loss and adherence better than any other dietary factor in a six-month trial, so this number is worth the ten seconds.
Servings you will actually eat, times the calories per serving. The label's job is to tell you about one serving; your job is to be honest about how many. A 150 g bag of chips eaten in one sitting is five servings and 800 kcal [2]; logging one serving is the single most common way a 500 kcal deficit [17] becomes a 100 kcal one.
The Ingredients List
Ingredients are listed by weight, heaviest first. If sugar in any of its names, sucrose, glucose, fructose, corn syrup, maltodextrin, dextrose, invert syrup, concentrated fruit juice, appears in the first three ingredients, the product is a sweet. If the list runs to fifteen items including emulsifiers, modified starches, flavourings and hydrolysed proteins, the product is ultra-processed, the category that produced about 508 extra calories a day when people ate it freely in a controlled trial [18]. The length of the list is itself information.
Reading an Indian Label
The FSSAI format mandates energy in kcal, protein, carbohydrate with total and added sugars, total fat with saturated and trans fat where fat exceeds 0.5%, cholesterol for animal fats, and sodium, per 100 g and per serve with the percentage of recommended daily allowance [4]. Older stock may still carry the pre-2020 format with no added-sugar line and no per-serve column. Read the per-100 g column to compare two biscuits; read the per-serve column, and check the serving weight against the pack, to log what you ate. Energy factors are the standard 4 kcal per gram of carbohydrate and protein and 9 for fat [4], so the calorie line can be checked against the macronutrients in a few seconds when a label looks wrong.
Set your own daily figures in the calorie calculator and macro calculator; the label's 2,000 kcal reference is a convenience, not your number.
That is where tracking earns its keep. The label tells you about one serving of one product; the day is thirty servings of twenty products, and the arithmetic is where honest intentions fail. Snap a photo of the label, or of the plate, or type "150 g bag salted chips" and track it automatically with Caltrac. You will see protein, fibre and added sugar for the day against your own targets rather than a 2,000 kcal stranger's, and your Apple Health-powered net calorie count shows how the packets added up. Read the serving size; let the app do the multiplication.
Frequently Asked Questions
What should I look at first on a nutrition label? The serving size and the number of servings in the pack, because every other number is per serving [1]. Then calories, added sugars, saturated fat and sodium to limit, and fibre and protein to get more of.
What does percent daily value mean? How much of a day's reference intake, based on 2,000 calories, one serving provides. Five percent or less is low; 20% or more is high [1]. The reference values include 50 g added sugars, 28 g fibre and 2,300 mg sodium [5].
How accurate are calorie labels? Snack foods measured by calorimetry averaged 4.3% more calories than labelled [13]; the legal tolerance allows up to 20% over [12]. Restaurant foods averaged 18% over their stated values [14].
What is the difference between total sugars and added sugars? Total sugars include naturally occurring sugar in milk and fruit; added sugars are those added in processing, and should stay under 10% of calories, about 50 g a day [7] [8].
How do I read an Indian food label? FSSAI labels give values per 100 g and per serve with percentage of recommended daily allowance; the per-100 g column compares products and the per-serve column, checked against the pack, is for logging [4].
How much protein should a food have to count as high protein? A useful rule is 10 g or more of protein per 100 calories; Greek yogurt is about 17.6 g per 100 kcal [9], while many "protein" cereals and bars are under 4.
References
- US Food and Drug Administration. How to Understand and Use the Nutrition Facts Label (serving size; 2,000 calories as a general guide; 5% DV or less is low, 20% DV or more is high). fda.gov
- USDA FoodData Central. Snacks, potato chips, plain, salted: 532 kcal per 100 g. SR Legacy 169677. fdc.nal.usda.gov
- USDA FoodData Central. Peanut butter, smooth: 598 kcal, 22.2 g protein per 100 g; 2 tablespoons 32 g. SR Legacy 172470. fdc.nal.usda.gov
- Food Safety and Standards Authority of India. Food Safety and Standards (Labelling and Display) Regulations, 2020, compendium version II (nutrition information per 100 g or 100 ml or per serve, with per-serve percentage of RDA based on 2,000 kcal, 67 g fat, 22 g saturated fat, 2 g trans fat, 50 g added sugar and 2,000 mg sodium; tolerance of minus 10 percent). fssai.gov.in
- US Food and Drug Administration. Daily Value on the Nutrition and Supplement Facts Labels (added sugars 50 g; dietary fibre 28 g; sodium 2,300 mg; saturated fat 20 g; protein 50 g; calcium 1,300 mg; iron 18 mg; potassium 4,700 mg). fda.gov
- Leidy HJ, et al. The role of protein in weight loss and maintenance. American Journal of Clinical Nutrition. 2015;101(6):1320S-1329S. pubmed.ncbi.nlm.nih.gov
- US Department of Agriculture and US Department of Health and Human Services. Dietary Guidelines for Americans, 2020-2025, Executive Summary (added sugars and saturated fat each under 10 percent of calories from age 2; sodium under 2,300 mg a day). dietaryguidelines.gov
- World Health Organization. WHO calls on countries to reduce sugars intake among adults and children (2015 sugars guideline). who.int
- USDA FoodData Central. Yogurt, Greek, nonfat, plain: 54 kcal, 9.5 g protein per 100 g. SR Legacy 171312. fdc.nal.usda.gov
- USDA FoodData Central. Cereals ready-to-eat, granola, homemade: 489 kcal, 13.7 g protein, 8.9 g fibre, 19.8 g sugar per 100 g. FDC ID 171646. fdc.nal.usda.gov
- USDA FoodData Central. Beverages, carbonated, cola, regular: 42 kcal, 9.9 g sugar per 100 g. SR Legacy 174852. fdc.nal.usda.gov
- US Code of Federal Regulations, Title 21 §101.9(g): a food is misbranded if calories, sugars, fat, saturated fat, trans fat, cholesterol or sodium exceed the declared value by more than 20 percent; naturally occurring protein, fibre, vitamins and minerals must be at least 80 percent of the declared value. ecfr.gov
- Jumpertz R, Venti CA, Le DS, Michaels J, Parrington S, Krakoff J, Votruba S. Food label accuracy of common snack foods. Obesity. 2013;21(1):164-169. pubmed.ncbi.nlm.nih.gov
- Urban LE, et al. The accuracy of stated energy contents of reduced-energy, commercially prepared foods. Journal of the American Dietetic Association. 2010;110(1):116-123. pubmed.ncbi.nlm.nih.gov
- US Food and Drug Administration. Menu Labeling Requirements (chains with 20 or more locations must list calories). fda.gov
- Block JP, et al. Consumers' estimation of calorie content at fast food restaurants: cross sectional observational study. BMJ. 2013;346:f2907. pubmed.ncbi.nlm.nih.gov
- Jensen MD, et al. 2013 AHA/ACC/TOS guideline for the management of overweight and obesity in adults. Circulation. 2014;129(25 Suppl 2):S102-S138. pubmed.ncbi.nlm.nih.gov
- Hall KD, et al. Ultra-Processed Diets Cause Excess Calorie Intake and Weight Gain: An Inpatient Randomized Controlled Trial of Ad Libitum Food Intake. Cell Metabolism. 2019;30(1):67-77. pubmed.ncbi.nlm.nih.gov