


Body mass index is the most widely used health number in the world, and it was never designed to be used on you. It was built in the 1830s to describe populations, adopted by insurers and then by the World Health Organization because it is cheap and needs only a scale and a tape, and it has been stretched ever since into a personal verdict it cannot support. BMI is a useful first screen and a poor final answer. This article explains what the number means, where it goes wrong, who it misclassifies, and what to measure alongside it.
You can get your own figure in seconds with Caltrac's free BMI calculator. Read the rest of this before you decide what it means.
What BMI Is
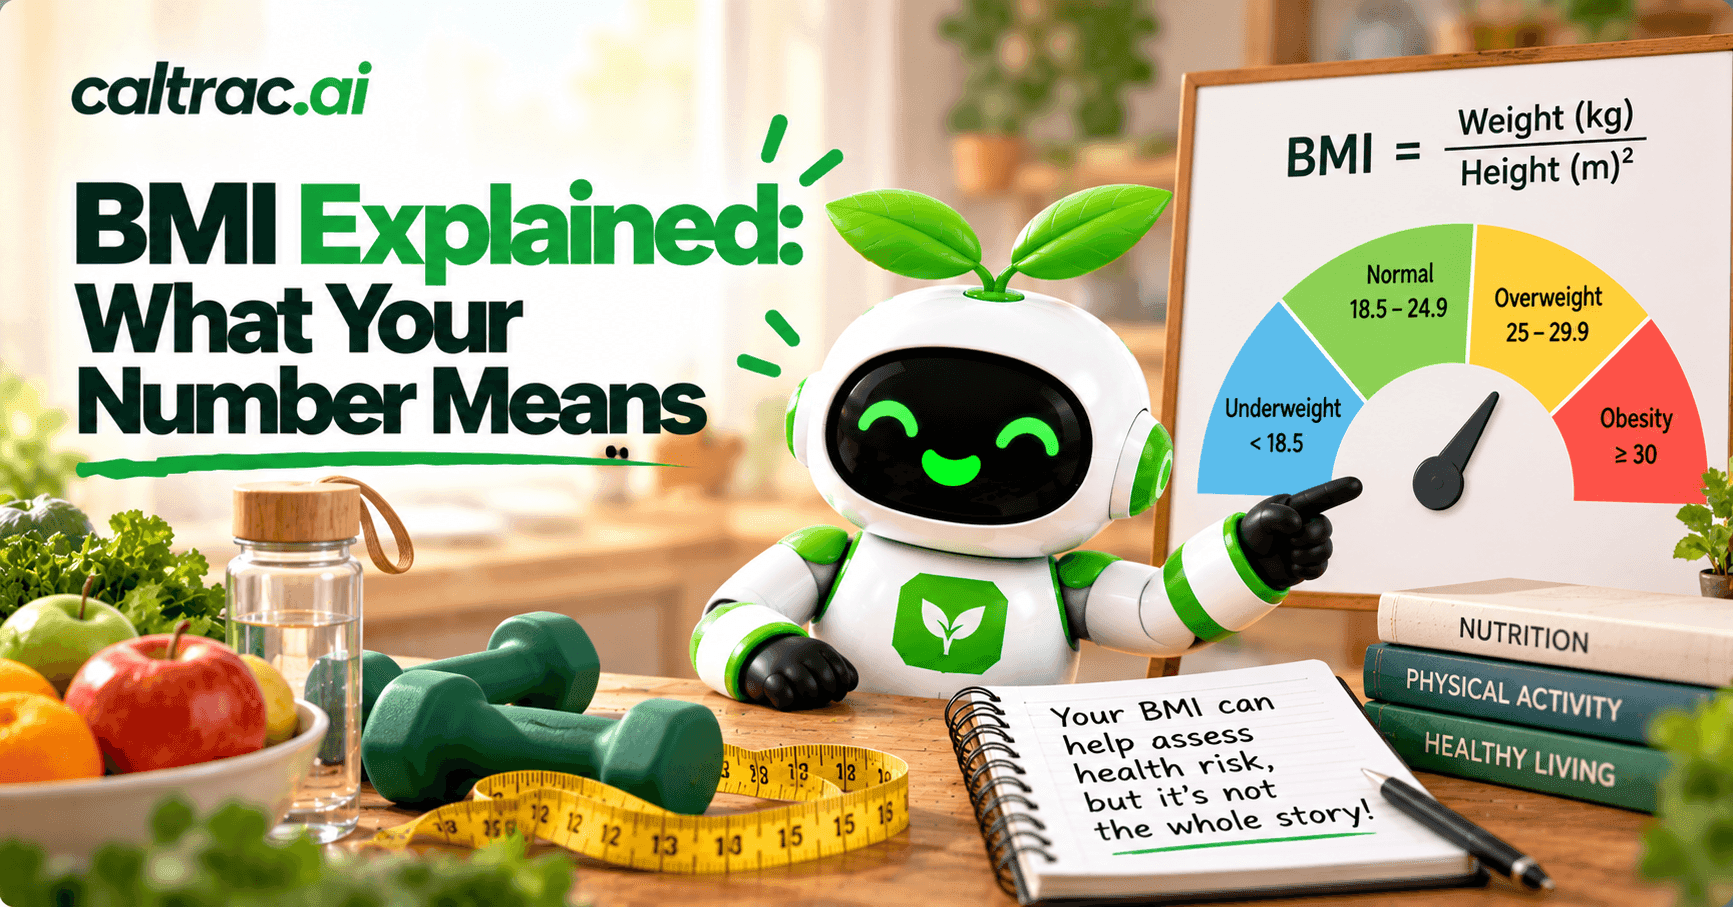
BMI is weight in kilograms divided by height in metres squared. A 70 kg person who is 1.75 m tall has a BMI of 70 ÷ (1.75 × 1.75) = 22.9. The WHO categories, which almost every clinic and chart uses, are:
| BMI | WHO category |
|---|---|
| Under 18.5 | Underweight |
| 18.5 to 24.9 | Healthy weight |
| 25 or more | Overweight |
| 30 or more | Obesity |
The WHO defines overweight as a BMI of 25 or more and obesity as 30 or more [1]; the "25 to 29.9" band is simply the overweight range below obesity. Those thresholds were set for populations, as round numbers that tracked disease risk on average across large groups of mostly European-ancestry adults. That origin explains every limitation that follows.
Where BMI Fails
It cannot see fat
BMI measures mass, not what the mass is made of. When researchers compared BMI against directly measured body fat in 13,601 American adults, a BMI of 30 or more picked out fat-defined obesity with high specificity but very poor sensitivity: it caught just 36% of men and 49% of women who actually had excess body fat. By BMI, 19% of men and 25% of women were obese; by body fat, 44% and 52% were [2]. In plain terms, BMI misses more than half the people it is supposed to find, and it misses them in the direction of false reassurance.
The reverse error is familiar to anyone who lifts weights. Muscle is denser than fat, so a muscular 85 kg man at 1.78 m carries a BMI of 26.8 and is "overweight" by the chart while carrying less fat than many people in the healthy range. A critical review summarised the problem bluntly: BMI "is a rather poor indicator of percent of body fat" and tells you nothing about where fat is stored [3].
It cannot see where the fat is
Fat around the organs, visceral fat, drives metabolic risk far more than fat on the hips and thighs, and BMI is blind to the difference. An international consensus statement from the IAS and ICCR concluded that waist circumference adds independent information to BMI for predicting illness and death, that "BMI alone is not sufficient to properly assess or manage the cardiometabolic risk," and that waist should be treated as a vital sign in clinical practice [4]. A meta-analysis of 31 studies covering more than 300,000 adults found that waist-to-height ratio discriminated diabetes, hypertension and cardiovascular disease better than BMI, improving prediction by 4 to 5% [5].
Its thresholds are wrong for a large share of the world
The WHO's own expert consultation found that in Asian populations the risk of type 2 diabetes and cardiovascular disease rises at BMIs well below 25, and proposed additional action points at 23, 27.5, 32.5 and 37.5 for public health use while retaining the international cut-offs for comparison [6]. An Indian consensus statement went further, noting that "limits of normal BMI are narrower and lower in Asian Indians than in white Caucasians" and that revised cut-offs would classify an additional 10 to 15% of the Indian population as overweight or obese [7]. If you are of South Asian descent, a BMI of 24 is not the comfortable margin the standard chart implies.
"Overweight" is not what it sounds like
The largest analysis of BMI and death, 97 studies with 2.88 million people and more than 270,000 deaths, found that people in the overweight range (25 to 29.9) had a 6% lower risk of death than those in the healthy range, and that grade 1 obesity (30 to 34.9) carried no significant excess risk. Only grades 2 and 3 obesity, a BMI of 35 or more, showed clearly higher mortality, at 29% [8]. The reasons are debated and include illness-related weight loss in the "healthy" group, but the finding stands: for mortality, the overweight category is not a danger zone, and the word does more harm than the number.
It cannot track a diet properly
When you lose weight, BMI falls at the same rate whether the loss is fat or muscle. On a calorie-restricted diet with too little sleep, people lost the same weight but 55% less fat and 60% more lean mass than when well rested [9]; athletes losing weight fast lost muscle while slower losers gained it [10]. BMI would have scored all of those outcomes identically. The number you want to move is body fat, and BMI cannot tell you whether you did.
What BMI Is Still Good For
None of this makes BMI useless. It is free, repeatable and strongly correlated with body fat across populations, which is exactly what a screening tool should be. At the extremes it is unambiguous: a BMI of 40 is not muscle, and a BMI of 16 is not fine. The 2021 to 2023 US survey found 40.3% of adults with a BMI of 30 or more and 9.7% at 40 or more [11]; for tracking a population, nothing else is practical. The failure is in treating a population statistic as an individual diagnosis.
What to Measure Instead, or As Well
Waist circumference. A tape measure at the level of the navel, after a normal exhale. The consensus statement recommends it as a routine vital sign because it captures the visceral fat BMI misses [4]. Track the trend; it falls when you lose fat even when the scale is stubborn.
Waist-to-height ratio. Divide waist by height in the same units. It outperformed BMI and waist alone in the meta-analysis [5], and it needs no chart adjusting for sex or ethnicity.
Body composition. A DXA scan or a reasonable bioimpedance scale tells you what BMI cannot: how much of you is fat. Fat-free mass also happens to be the main driver of your metabolic rate, explaining about 63% of the variation in BMR between people [12], which is why preserving it matters for every diet you will ever do.
Progress photos and clothes. Unscientific and extremely informative. A waistband that loosens while the scale holds is fat loss with muscle retention, the best possible outcome and one BMI records as failure.
How to Use the BMI Calculator Properly
- Run the BMI calculator once, for the category, and then stop checking it. It will not move fast enough to be useful week to week.
- If you are of South Asian, East Asian or Southeast Asian descent, read 23 as the start of the overweight range and 27.5 as the start of obesity-level risk [6].
- If you train with weights and your BMI reads 25 to 29, measure your waist before worrying.
- If your BMI is 30 or more, treat it as a reason to act, not a verdict on your health; the mortality data say the risk rises steeply from 35, not 25 [8].
- Set your diet by the numbers that respond to it: a calorie target from the calorie calculator, a protein target of 1.2 to 1.6 g per kilogram from the macro calculator to protect lean mass [13], and a monthly waist measurement.
That is where tracking earns its keep. Snap a photo of your meal or type what you ate and track it automatically with Caltrac. You will see protein and calories against the targets that actually determine whether the weight you lose is fat, and your Apple Health-powered net calorie count will show the deficit doing its work long before any chart category changes. Know your BMI once; let the app manage the numbers that move.
Frequently Asked Questions
What is a healthy BMI? The WHO healthy range is 18.5 to 24.9, with overweight from 25 and obesity from 30 [1]. For Asian populations the WHO suggests action points at 23 and 27.5 [6].
Is BMI accurate? As a screen for populations, yes. For individuals, it misses more than half of people with excess body fat, catching only 36% of men and 49% of women with fat-defined obesity in a national sample [2].
Why is BMI wrong for muscular people? BMI measures total weight, and muscle is denser than fat, so a lean, muscular person can read as overweight. BMI "is a rather poor indicator of percent of body fat" [3].
Is being overweight by BMI dangerous? Not by itself. In a meta-analysis of 2.88 million people, the overweight range had slightly lower mortality than the healthy range; risk rose clearly only at a BMI of 35 or more [8].
What is better than BMI? Waist circumference and waist-to-height ratio predict cardiometabolic risk better than BMI [5] [4]. Body composition measurement is better still.
What BMI should Indians aim for? Lower than the standard chart. Indian consensus guidance puts normal BMI limits "narrower and lower" than for white populations [7], consistent with the WHO's Asian action point of 23 [6].
References
- World Health Organization. Obesity and overweight (fact sheet): overweight is a BMI of 25 or more, obesity a BMI of 30 or more. who.int
- Romero-Corral A, et al. Accuracy of body mass index in diagnosing obesity in the adult general population. International Journal of Obesity. 2008;32(6):959-966. pubmed.ncbi.nlm.nih.gov
- Nuttall FQ. Body Mass Index: Obesity, BMI, and Health: A Critical Review. Nutrition Today. 2015;50(3):117-128. pubmed.ncbi.nlm.nih.gov
- Ross R, et al. Waist circumference as a vital sign in clinical practice: a Consensus Statement from the IAS and ICCR Working Group on Visceral Obesity. Nature Reviews Endocrinology. 2020;16(3):177-189. pubmed.ncbi.nlm.nih.gov
- Ashwell M, Gunn P, Gibson S. Waist-to-height ratio is a better screening tool than waist circumference and BMI for adult cardiometabolic risk factors: systematic review and meta-analysis. Obesity Reviews. 2012;13(3):275-286. pubmed.ncbi.nlm.nih.gov
- WHO Expert Consultation. Appropriate body-mass index for Asian populations and its implications for policy and intervention strategies. Lancet. 2004;363(9403):157-163. pubmed.ncbi.nlm.nih.gov
- Misra A, et al. Consensus statement for diagnosis of obesity, abdominal obesity and the metabolic syndrome for Asian Indians and recommendations for physical activity, medical and surgical management. Journal of the Association of Physicians of India. 2009;57:163-170. pubmed.ncbi.nlm.nih.gov
- Flegal KM, Kit BK, Orpana H, Graubard BI. Association of all-cause mortality with overweight and obesity using standard body mass index categories: a systematic review and meta-analysis. JAMA. 2013;309(1):71-82. pubmed.ncbi.nlm.nih.gov
- Nedeltcheva AV, et al. Insufficient sleep undermines dietary efforts to reduce adiposity. Annals of Internal Medicine. 2010;153(7):435-441. pubmed.ncbi.nlm.nih.gov
- Garthe I, et al. Effect of two different weight-loss rates on body composition and strength and power-related performance in elite athletes. International Journal of Sport Nutrition and Exercise Metabolism. 2011;21(2):97-104. pubmed.ncbi.nlm.nih.gov
- CDC/NCHS. Obesity and Severe Obesity Prevalence in Adults: United States, August 2021-August 2023 (Health E-Stat 111). cdc.gov
- Johnstone AM, et al. Factors influencing variation in basal metabolic rate include fat-free mass, fat mass, age, and circulating thyroxine but not sex, circulating leptin, or triiodothyronine. American Journal of Clinical Nutrition. 2005;82(5):941-948. pubmed.ncbi.nlm.nih.gov
- Leidy HJ, et al. The role of protein in weight loss and maintenance. American Journal of Clinical Nutrition. 2015;101(6):1320S-1329S. pubmed.ncbi.nlm.nih.gov