


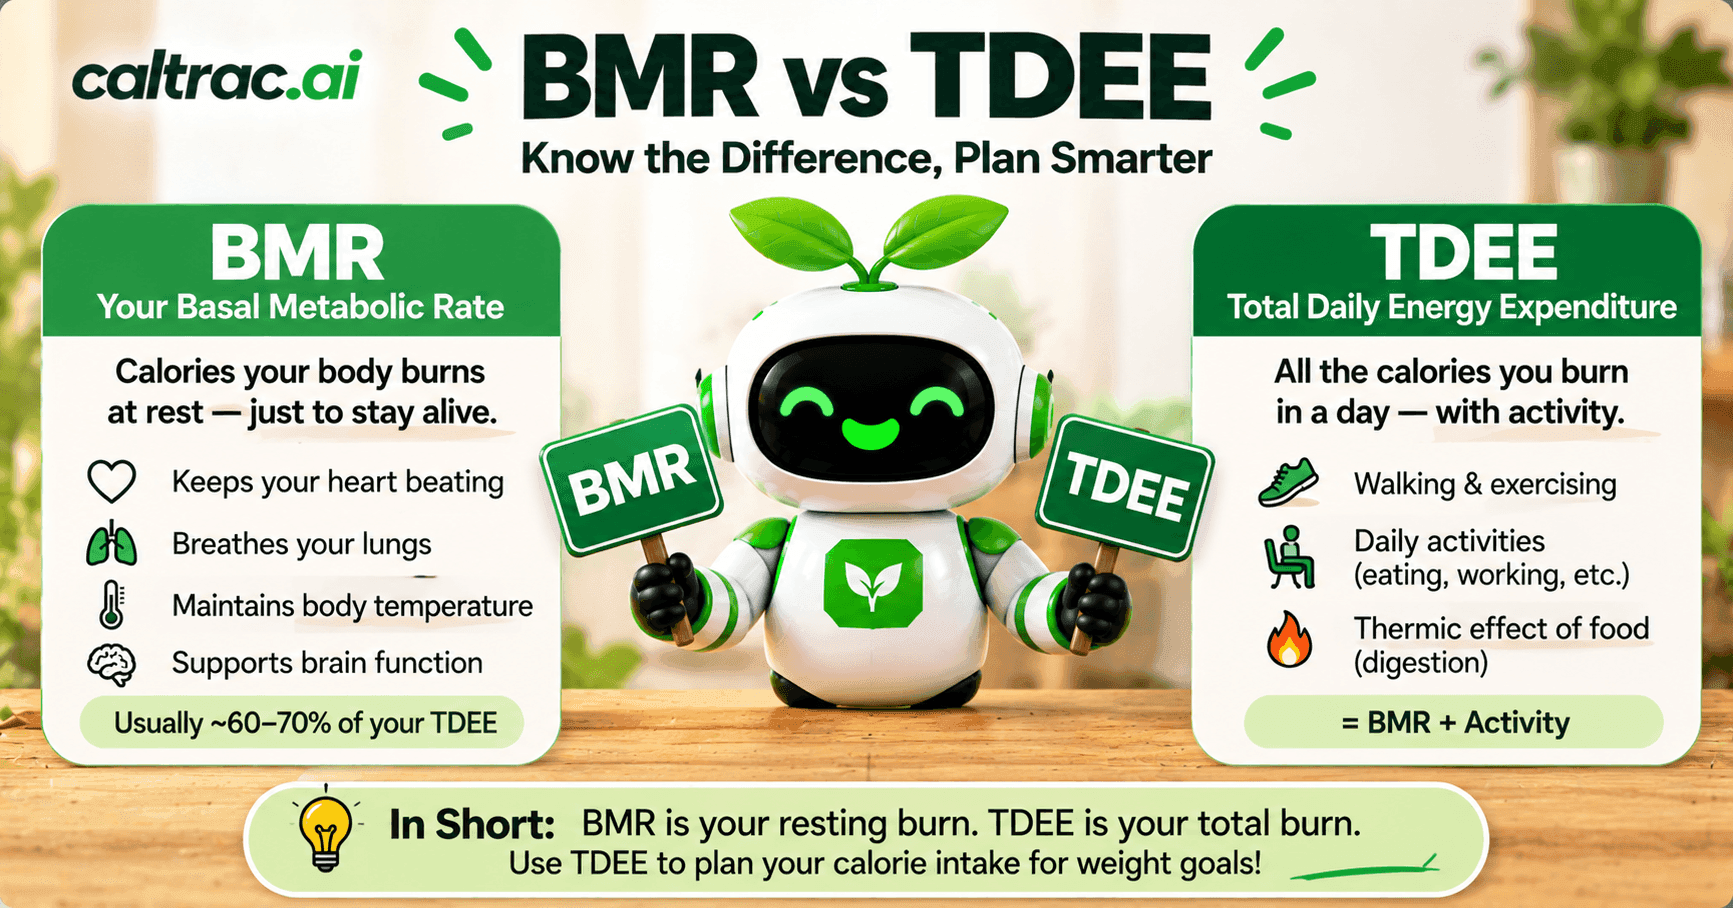
Every calorie calculator gives you two numbers, and most people use the wrong one. BMR is what your body burns lying still. TDEE is what it burns living your actual day. Eat at your BMR and you will be hungry, tired and losing muscle; eat at your TDEE and your weight will not move. The gap between them is where every diet decision lives, and understanding it is the difference between a calorie target that works and one pulled from the air.
This article explains both numbers, how they are estimated, how accurate the estimates are, what moves them, and how to use them. Caltrac's free BMR calculator and calorie calculator give you both in under a minute.
The Two Numbers
BMR, basal metabolic rate, is the energy your body uses for its basic functions at complete rest: breathing, circulation, cell repair, brain activity, keeping warm. It is measured first thing in the morning, fasted, lying down, and it is the largest single item in your energy budget, typically 60 to 75% of total daily expenditure [1]. RMR, resting metabolic rate, is the same idea measured under slightly less strict conditions and runs a few percent higher; for practical purposes the two are interchangeable.
TDEE, total daily energy expenditure, is BMR plus everything else, and the everything else has two parts [2]:
- Diet-induced thermogenesis: the cost of digesting, absorbing and storing food, about 5 to 15% of daily expenditure, higher on a high-protein diet and lower on a high-fat one.
- Physical activity: both deliberate exercise and the far larger category of ordinary movement, from walking to the kitchen to fidgeting. This is the only component you control directly.
TDEE is your maintenance calories: eat it and your weight holds. Every weight-loss target is TDEE minus something.
How BMR Is Estimated
Measuring BMR properly needs a metabolic cart in a laboratory. Everyone else uses an equation. The one Caltrac uses, Mifflin-St Jeor, was derived in 1990 from measurements of 498 healthy adults and remains the standard [3]:
- Men: 10 × weight (kg) + 6.25 × height (cm) − 5 × age + 5
- Women: 10 × weight (kg) + 6.25 × height (cm) − 5 × age − 161
A systematic review of the common equations found Mifflin-St Jeor the most reliable, predicting measured resting rate to within 10% in more people than any other, with the narrowest error range [4]. Read that carefully: the best available equation is wrong by more than 10% in a meaningful minority of people. Treat the output as a starting estimate to be corrected by what the scale does over three or four weeks.
Worked example. A 40-year-old woman, 65 kg, 165 cm: 650 + 1,031 − 200 − 161 = 1,320 kcal. That is her BMR: the calories she would burn in a day of lying still.
How TDEE Is Estimated
Multiply BMR by an activity factor. The FAO/WHO/UNU expert consultation defines the bands by physical activity level, or PAL: sedentary or light activity 1.40 to 1.69, active or moderately active 1.70 to 1.99, vigorous 2.00 to 2.40, with values above 2.40 "difficult to maintain over a long period" [5]. The 1.2 multiplier found in many calculators corresponds to totally inactive, bed-bound people, whose mean PAL the same report puts at 1.21; it is a floor, not a lifestyle category [5].
Our 65 kg woman with an office job and a daily walk sits around PAL 1.55, giving a TDEE of 1,320 × 1.55 = 2,046 kcal. If she trains hard four times a week she is nearer 1.75 and 2,310 kcal. The difference between those two guesses is 264 calories a day, more than half a typical weight-loss deficit, which is why honesty about the activity multiplier matters more than precision anywhere else.
What Actually Determines Your BMR
People believe their metabolism is uniquely slow or fast. The data say it is mostly their body size. In 150 adults measured directly, fat-free mass explained 63% of the variation in BMR between people, fat mass another 6% and age 2%; sex made no independent difference once body composition was accounted for [6]. About a quarter of the variation remained unexplained, which is real and is the part people feel, but it is a quarter, not the whole story.
Three things follow. More muscle means a higher BMR, which is why resistance training and adequate protein matter during weight loss: higher-protein diets preserve about 140 kcal/day more resting expenditure in calorie-restricted trials [7]. Losing weight lowers BMR, because there is less of you to run. And age matters less than assumed: the largest study of energy expenditure across the lifespan, using doubly labelled water in people from 8 days to 95 years old, found that expenditure adjusted for body composition is stable from 20 to 60 and declines only in older age [8]. Middle-aged weight gain is mostly less movement and more food, not a metabolism that stopped.
What Moves TDEE
Since BMR is largely fixed by body size, the levers are in the other two components.
Non-exercise movement is the biggest. In a study that measured posture every half-second for ten days, lean people stood and moved for about two hours a day more than obese people, a difference worth roughly 350 kcal a day [9]. Steps, standing, chores and fidgeting outweigh most gym sessions.
Exercise counts, but less than the machine says. Across 1,754 adults, about 28% of the energy spent on activity was offset by reductions elsewhere in the body's budget, so only 72% of a workout's calories translate into extra daily expenditure [10]. Wrist trackers compound the problem: none of seven tested devices estimated energy expenditure within 20% of the truth [11]. Trust the step count, not the calorie number.
Protein raises the digestion cost. Diet-induced thermogenesis is highest for protein among the macronutrients [2], one more reason a higher-protein diet produces a slightly larger real deficit than the arithmetic suggests.
Why Your TDEE Falls as You Lose Weight
A smaller body burns less, so TDEE drops as the diet works. On top of that, the body reduces expenditure a little beyond what the loss of tissue predicts, by roughly 10 to 15% after a 10% weight loss [12]. The NIH's dynamic model, which powers its Body Weight Planner [13], shows the consequence: a fixed deficit produces loss that slows and plateaus, with half the eventual weight change arriving in about a year [14]. The fix is mechanical: recalculate TDEE every 5 kg lost and reset the target.
Using the Two Numbers
- Get BMR from the BMR calculator. Never eat below it for long; it is what your organs need. Clinical guidelines set floors of 1,200 kcal for women and 1,500 for men without supervision [15], which for most people sits just above BMR.
- Get TDEE from the calorie calculator by choosing the activity level honestly. If in doubt, pick the lower one and let the scale correct you.
- Set the target at TDEE minus 500 to 750 kcal [15]. For our example woman at 2,046 maintenance, that is 1,300 to 1,550 kcal, which is why the activity multiplier matters: at the wrong PAL her "deficit" could be her maintenance.
- Check in four weeks. If weight is falling at 0.5 to 0.7 kg a week, the estimate was right. If not, adjust intake by 100 to 200 kcal, not the equation.
- Recalculate every 5 kg [14].
That is where tracking earns its keep. Snap a photo of each meal or type what you ate and track it automatically with Caltrac. You will see intake against the TDEE-based target you set, and your Apple Health-powered net calorie count folds in the activity side so the number you are watching is the real gap, not the estimated one. Estimate once; let the app and the scale refine it.
Frequently Asked Questions
What is the difference between BMR and TDEE? BMR is the energy you burn at complete rest, about 60 to 75% of the total [1]. TDEE adds digestion and all physical activity [2] and equals your maintenance calories.
Should I eat my BMR or my TDEE to lose weight? Neither exactly. Eat below TDEE by 500 to 750 kcal [15] and stay above BMR. Eating at BMR is usually too aggressive; eating at TDEE maintains weight.
How accurate is a BMR calculator? The best equation, Mifflin-St Jeor, is within 10% of measured values for most people but not all [4]. Use the scale over a month to correct it.
Does metabolism slow with age? Much less than believed. Body-composition-adjusted energy expenditure is stable from age 20 to 60 and declines only in older adulthood [8].
Can I increase my BMR? Mainly by gaining muscle, since fat-free mass explains about 63% of BMR variation [6]. Protein and resistance training preserve it during weight loss [7].
Why has my TDEE dropped during my diet? A lighter body needs fewer calories, and the body adapts a further 10 to 15% beyond that [12] [14]. Recalculate your target as you lose.
References
- Huang L, et al. Resting metabolic rate in obesity. Postgraduate Medical Journal. 2025;101(1195):396-410. pubmed.ncbi.nlm.nih.gov
- Westerterp KR. Diet induced thermogenesis. Nutrition & Metabolism. 2004;1:5. pubmed.ncbi.nlm.nih.gov
- Mifflin MD, St Jeor ST, Hill LA, Scott BJ, Daugherty SA, Koh YO. A new predictive equation for resting energy expenditure in healthy individuals. American Journal of Clinical Nutrition. 1990;51(2):241-247. pubmed.ncbi.nlm.nih.gov
- Frankenfield D, Roth-Yousey L, Compher C. Comparison of predictive equations for resting metabolic rate in healthy nonobese and obese adults: a systematic review. Journal of the American Dietetic Association. 2005;105(5):775-789. pubmed.ncbi.nlm.nih.gov
- FAO/WHO/UNU. Human Energy Requirements: Report of a Joint FAO/WHO/UNU Expert Consultation, Rome 2001. Chapter 5, Energy requirements of adults (physical activity level categories). fao.org
- Johnstone AM, Murison SD, Duncan JS, Rance KA, Speakman JR. Factors influencing variation in basal metabolic rate include fat-free mass, fat mass, age, and circulating thyroxine but not sex, circulating leptin, or triiodothyronine. American Journal of Clinical Nutrition. 2005;82(5):941-948. pubmed.ncbi.nlm.nih.gov
- Wycherley TP, et al. Effects of energy-restricted high-protein, low-fat compared with standard-protein, low-fat diets: a meta-analysis of randomized controlled trials. American Journal of Clinical Nutrition. 2012;96(6):1281-1298. pubmed.ncbi.nlm.nih.gov
- Pontzer H, et al. Daily energy expenditure through the human life course. Science. 2021;373(6556):808-812. pubmed.ncbi.nlm.nih.gov
- Levine JA, et al. Interindividual variation in posture allocation: possible role in human obesity. Science. 2005;307(5709):584-586. pubmed.ncbi.nlm.nih.gov
- Careau V, et al. Energy compensation and adiposity in humans. Current Biology. 2021;31(20):4659-4666. pubmed.ncbi.nlm.nih.gov
- Shcherbina A, et al. Accuracy in Wrist-Worn, Sensor-Based Measurements of Heart Rate and Energy Expenditure in a Diverse Cohort. Journal of Personalized Medicine. 2017;7(2):3. pubmed.ncbi.nlm.nih.gov
- Rosenbaum M, Leibel RL. Adaptive thermogenesis in humans. International Journal of Obesity. 2010;34 Suppl 1:S47-S55. pubmed.ncbi.nlm.nih.gov
- National Institute of Diabetes and Digestive and Kidney Diseases. Body Weight Planner (based on the Hall dynamic model). niddk.nih.gov
- Hall KD, et al. Quantification of the effect of energy imbalance on bodyweight. Lancet. 2011;378(9793):826-837. pubmed.ncbi.nlm.nih.gov
- Jensen MD, et al. 2013 AHA/ACC/TOS guideline for the management of overweight and obesity in adults. Circulation. 2014;129(25 Suppl 2):S102-S138. pubmed.ncbi.nlm.nih.gov